
Qatar / Business
Qatar’s October Port Rebound: What the Cargo Numbers Tell Importers
Mwani Qatar reported more than 59,000 TEUs of container traffic in October, a 9% increase from September. The November 1 update gives businesses a fresh snapshot of maritime activity, while leaving important questions about cargo mix, delivery reliability and sustained demand open.
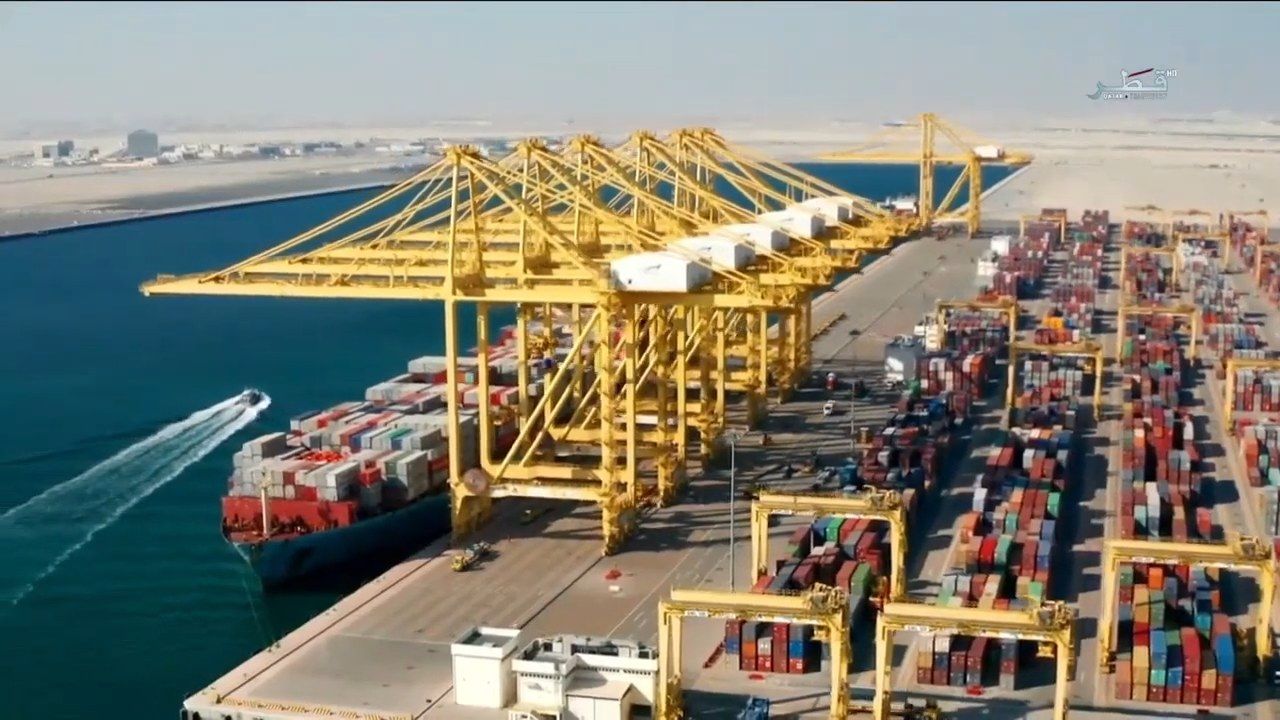
The November 1 update
Qatar News Agency reported on November 1 that Mwani Qatar handled more than 59,000 twenty-foot equivalent units, or TEUs, during October. Container throughput was 9% higher than in September 2026. The ports received 249 vessels, a month-on-month increase of 56%. The update also recorded more than 66,000 tonnes of general cargo and more than 61,000 livestock heads, alongside 1,655 vehicles and equipment units.
These figures describe activity during a completed month. They establish that several traffic measures increased against September; they do not establish a full-year growth trend. For a trading company or logistics buyer, the immediate value is a dated reference point against which to compare its own shipments, rather than a prediction of what November will bring.
Analysis: read the measurement before the percentage
MyGCCNews analysis begins with a distinction that matters when figures move quickly. A TEU measures standardized container capacity. It is not automatically the number of individual metal boxes, because containers come in different sizes. Vessel arrivals measure calls, while cargo measures describe what passed through the port system. Those series can move at different speeds without contradicting one another.
The differing October increases therefore invite questions about ship size, cargo type and timing rather than a single explanation. A larger number of calls might include vessels carrying less cargo per call, or a different mix of services. The published totals do not identify the contribution of each possibility. Treating the largest percentage as a verdict on the whole economy would conceal those missing details.
Why the cargo mix affects the business question
Mwani’s descriptions of Hamad Port distinguish container terminals from facilities serving general cargo and other cargo categories. Its general cargo terminal includes transit sheds, cold storage and paved handling space. The multi-use terminal covers separate requirements for grain, vehicles and livestock. These are different operating environments, not interchangeable versions of a container yard.
An importer should consequently match the public indicator to the product being moved. A distributor bringing packaged consumer goods has a different exposure from a contractor receiving machinery or a business handling perishable products. The useful question is whether the relevant handling chain can meet the required delivery condition. An aggregate increase cannot reveal whether a specific item will clear, transfer and reach a customer on schedule.
The missing link between the quay and the customer
For a business, the end of a sea voyage is only one milestone. A practical shipment record should separate vessel arrival, cargo availability, documentation completion, release, collection and final delivery. Recording those events consistently makes it possible to locate a delay instead of assigning every late order to the port. It also gives procurement teams evidence when comparing service proposals.
Consider two hypothetical deliveries that arrive on the same vessel. One may already have complete commercial paperwork and an arranged collection; the other may still require clarification from its supplier. Their customer delivery dates could differ even though the port arrival is identical. This example is a planning illustration, not a report of a problem at Hamad Port. It shows why national traffic totals cannot substitute for shipment-level records.
A more useful purchasing conversation
The October rebound provides an occasion to ask freight and logistics providers for clearer service definitions. A quote should identify what is included, which events start or stop a charging period, and which party supplies each document. A cheap ocean freight figure is difficult to compare with another offer unless the inland and handling assumptions are visible as well.
For recurring imports, businesses can build a short monthly dashboard around delivered cost, elapsed time, damaged or rejected deliveries and exceptions requiring staff intervention. These measures translate infrastructure into operating results. They also help a buyer distinguish a temporary disruption from a recurring weakness in its own process. The point is to make subsequent decisions traceable, rather than to assume that stronger national volume automatically improves every contract.
What would demonstrate a durable improvement
The next releases will matter because a sequence of comparable observations is more informative than one rebound. Readers should look for the same measurement basis, the same comparison period and an explanation of unusual movements. Seasonal purchasing, project deliveries and changes in vessel scheduling are possible analytical questions; the November 1 release does not quantify their influence on October.
A strong assessment would also combine volumes with reliable service information where available. More traffic can be commercially welcome, but users ultimately need predictable handling and delivery. Capacity, utilization and customer experience answer different questions. Keeping them separate makes both positive and negative conclusions more credible and prevents a monthly headline from carrying more weight than its evidence supports.
The implication for Qatar’s trading businesses
The confirmed news is a busier October across the reported container and vessel measures. The commercial implication is an opportunity to refresh assumptions, not a reason to relax them. Importers can compare the public figures with their own order cycle, ask whether delivery patterns changed and identify which part of the chain deserves attention before the next purchase.
For readers following Qatar’s broader diversification, ports are best understood as working infrastructure. Their importance becomes tangible when goods arrive in usable condition and on a schedule that businesses can plan around. October’s figures add a current data point to that story. The more consequential test will be whether subsequent activity and individual customer outcomes show a consistent pattern over time.
Gabriel Nicolaev – CyGuru